- January 11, 2022
- Swisens
Monitor invisible and allergenic pollen
Pollen is a major component of pathogenic bioaerosols transported through the air. Bioaerosols, invisible to the eye, spread very quickly and over long distances. Bioaerosols also cause allergic reactions and diseases, which can cause great harm and sometimes life-threatening situations for us humans as well as for animals and plants. With this awareness, it seems obvious that we should know more about the air we breathe.
Measuring pollen in the air is nothing new. In fact for more than 50 years scientists in aerobiology, physicians and meteorological services have been measuring local pollen concentrations using manual pollen traps, analyzing and counting pollen under a microscope (Hirst, 1952). However, this method has one major drawback. Namely, the results of the measurements are available one week too late. So we know only after a week which pollen was in the air on the day of the measurement. Every person with a pollen allergy knows that by that time the symptoms and discomfort are already there. Recent events such as the current pandemic or the dramatic events with thunderstorm asthma in Melbourne are examples that show even more clearly how important it is to measure and monitor biological agents in real time (Thien et al., 2018).
With automatic pollen monitoring, a solution is available that enables the measurement and monitoring of pollen concentrations in real time, continuously and all the time.
Why do we need automatic pollen monitoring?
In Switzerland, around one fifth of the population is affected by pollen allergy. Studies show that the number of diagnosed pollen allergy sufferers has risen steadily in Europe in recent decades (Lake et al., 2016). One of the main reasons for this is the advancing climate change (Kurganskiy et al., 2021).
In addition to pollen allergy sufferers, medical professionals or allergists, also use the information from pollen measurements. The information is used for observations as well as for prognoses for the diagnosis and treatment of allergy patients.
What initially causes only minor symptoms in allergy patients can later develop into a chronic respiratory disease and asthma. The consequences are an increase in direct and indirect health care costs related to allergies, currently estimated at between 50 and 150 billion euros per year in Europe (Zuberbier et al., 2014). For pollen allergy sufferers with asthma or hay fever, high pollen concentrations in combination with a thunderstorm can lead to problematic and life-threatening situations as in thunderstorm asthma. So we need to know at what point the pollen is in the air, when the concentrations increase and when we can breathe freely again. Everything so that we can prevent life-threatening situations and ensure a better quality of life.
So far, the traditional method of measuring pollen is still considered the standard and is widely used around the world. In detail, it allows a wide range of different pollen to be counted by expert eyes, but there are also a number of disadvantages. These include low temporal resolution and a delay of up to ten days. That is why traditional pollen measurement data cannot be used for reliable pollen information, nor for accurate pollen forecasting and early warning systems.
New technology provides remedy
With the new technology, the information is available in real time and allows a more accurate statement of the current pollen load trend. Once the automatic monitoring networks are active, this can dramatically improve pollen information and pollen forecasts through real-time data. In the following section we show an example of how MeteoSwiss integrates pollen data from automatic monitoring into its website and makes it accessible to the Swiss population. Thereby we make a short excursion on how automatic pollen monitoring works.
How does the automatic pollen monitoring work?
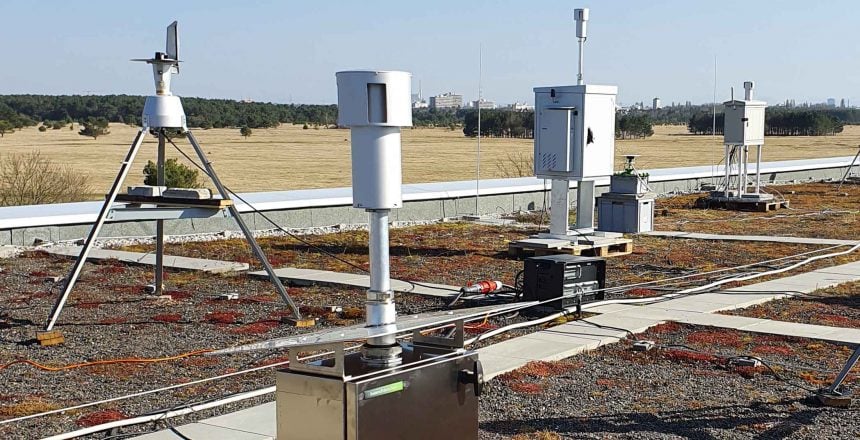
Automatic pollen monitoring means that a measuring system independently and continuously measures and monitors local pollen concentrations around the clock. In particular, the measuring system can distinguish between the different pollen types and detect the smallest changes in pollen concentration. This is followed by corresponding values, which are updated and output every minute. A detailed description of the process can be found on our website under Technology.
Consequently, the system detects at the smallest concentrations whether the release of allergic pollen and thus the pollen season has begun. During the pollen season, it determines and monitors the course of the pollen load and provides more precise information on when the season has ended. Thanks to digital transmission, there is no time delay until the measurement data reaches the end user. As a result, pollen allergy sufferers can take preventive measures to promote a mild course of symptoms. The following figure shows the pollen concentration of grasses in average daily values over the whole season.

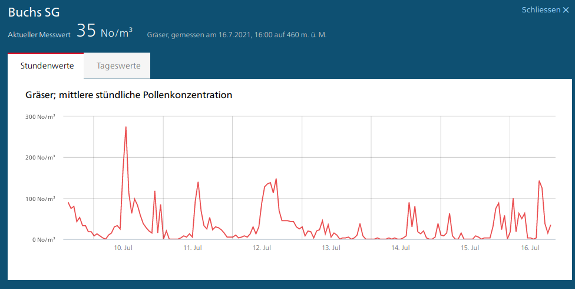
The next figure shows the pollen concentrations of grasses in hourly values between July 10 and July 16, 2021. The figure shows the course and the daily maximum and minimum values of the pollen concentration in the within the measured time period.
What solution does Swisens offer for automatic pollen monitoring?
In short, we offer a complete solution for automatic pollen monitoring. By this we mean the combination of hardware, software and services to make the implementation of automatic pollen monitoring as easy as possible for our customers. Therefore the SwisensEcosystem Pollen Monitoring was developed, which enables us to offer a measurement system, user-friendly software and related services for data management and maintenance. As a partner, we offer our customers assistance in the integration, setup and operation of automatic pollen monitoring – whether for a single measuring station or a large-scale network.

If you’d like to learn more, send us your questions at sales@swisens.ch or check out other articles on this topic.
References
Hirst, J. M. (1952). AN AUTOMATIC VOLUMETRIC SPORE TRAP. AN AUTOMATIC VOLUMETRIC SPORE TRAP, 39(2), 257–265. https://doi.org/10.1111/j.1744-7348.1952.tb00904.
Kurganskiy, A., Creer, S., De Vere, N., Griffith, G. W., Osborne, N. J., Wheeler, B. W., McInnes, R. N., Clewlow, Y., Barber, A., Brennan, G. L., Hanlon, H. M., Hegarty, M., Potter, C., Rowney, F., Adams-Groom, B., Petch, G. M., Pashley, C. H., Satchwell, J., De Weger, L. A., … Skjøth, C. A. (2021). Predicting the severity of the grass pollen season and the effect of climate change in Northwest Europe. https://doi.org/10.1126/sciadv.abd7658
Lake, I., Jones, N., Agneew, M., Goodness, C. M., Giorgi, F., Hamaoui-Laguel, L., Semenov, M. A., Solomon, F., Storkey, J., Vautard, R., & Epstein, M. M. (2016). Climate Change and Future Pollen Allergy in Europe. https://www.ncbi.nlm.nih.gov/pmc/articles/PMC5332176/
Thien, F., Beggs, P. J., Csutoros, D., Darvall, J., Hew, M., & Davies, J. M. (2018). The Melbourne epidemic thunderstorm asthma event 2016: An investigation of environmental triggers, effect on health services, and patient risk factors. https://www.thelancet.com/journals/lanplh/article/PIIS2542-5196(18)30120-7/fulltext
Zuberbier, T., Simoens, S., Lotvall, J., & K Church, M. (2014). Economic Burden of Inadequate Management of Allergic Diseases in the European Union: A GA2LEN Review.