- March 21, 2022
- Swisens
This article explains the basics of automatic aerosol particle identification. We explain how our measurement systems extract information on particle morphology from holographic images and how you can distinguish between different aerosol particles.
Determination of the particle morphology
Aerosol particles are often characterised by different analytical instruments based on their size distribution. In the real-time measurement and monitoring of bioaerosols, microbes and other particulate matter, the determination of morphological properties is particularly important to determine their origin, type or class. Simply put, we want to know what kind of particles are in the air. This knowledge gives us new insights into many applications. The automatic pollen monitoring is one of them. To distinguish the multitude of pollen from each other and at the same time still measure them in real time, we need far more information about the particles than just their size.
Microscopy vs. real-time measurement
For the real-time measurement of aerosol particles, there are various technologies for determining the particle morphology. The crucial factor is the way in which the particles are measured. For the measurement and identification of bioaerosols, microscopic analysis probably leads to the best results. This is because the size as well as the shape and surface structure can be recognised very well in the high-resolution images. However, microscopic analysis has one major disadvantage. The method does not allow real-time measurement of particles, because time-consuming laboratory analyses are necessary.
What technology do we use at Swisens and why?
SwisensPoleno Mars and SwisensPoleno Jupiter both use digital holography to determine particle morphology. This technology allows the systems to generate high-resolution images of passing particles in the aspirated airflow. In the next sections, we will explain what information our measurement systems obtain from the holographic images. You will also learn how to use this information to distinguish particles and for efficient data analysis.
Analysis of particle morphology from holographic images
SwisensPoleno Mars and SwisensPoleno Jupiter use digital holography to characterise aerosol particles. The holographic images give us a range of information on particle morphology. This can be used to classify and identify the particles. In the next section, we show how these characteristics can be used for differentiation.
Digital holography and particle properties
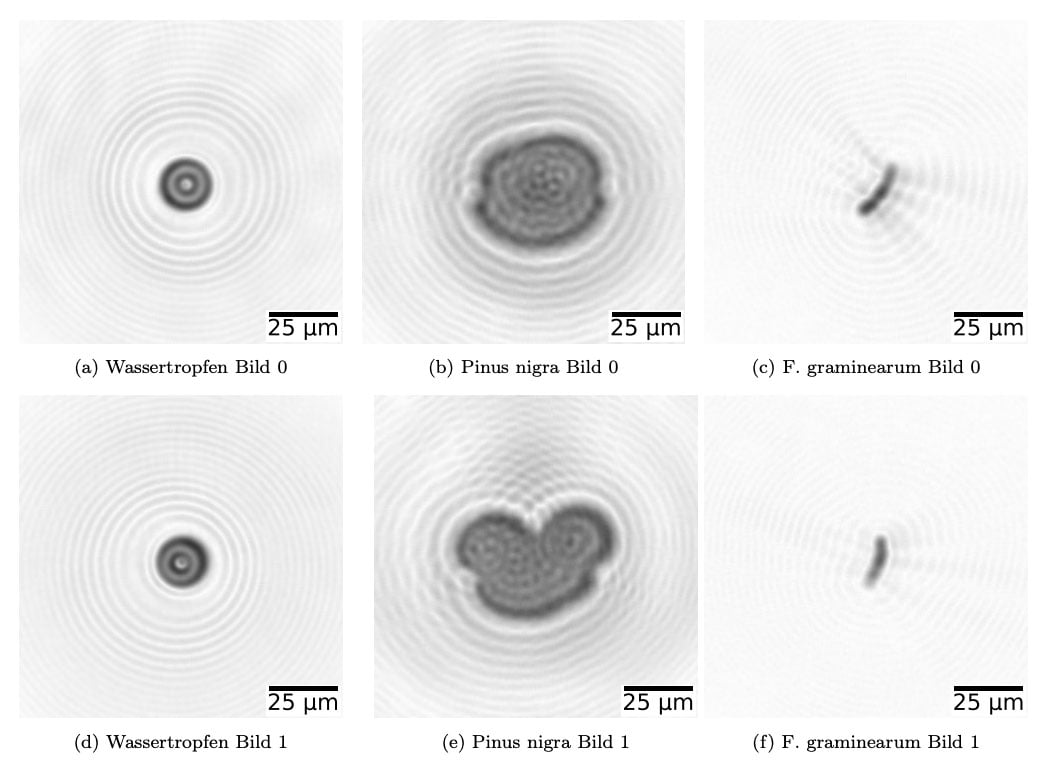
Let’s start with the image generation. Two holograms are recorded of each particle that flies through the measuring system. These wave fields are then reconstructed into focused intensity images.
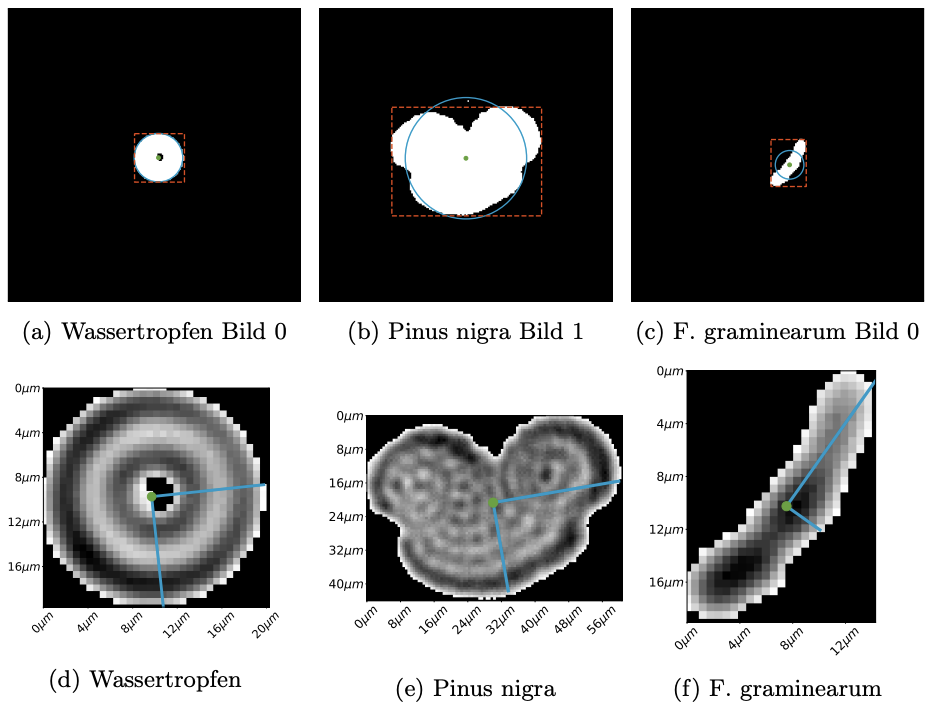
To obtain numerical characteristics of the particles, image processing algorithms are applied to both holographic images. First, the images are binarised. The binarisation is done with the help of a variable threshold. This creates a binary image from a greyscale image (Figure 1) as shown in Figure 2 (a) above. Next, the largest region found in the binary image, with equal pixel values is analysed using the algorithms provided by skimage.measure.regionprops. This procedure is used to determine the particle properties for the holographic images. The following table (Table 1) lists the most important properties. A nice example is Pinus in Figure 1 (b). It shows that both SwisensPoleno systems image particles with more complex morphology very well. Consequently, particles can be recognised or distinguished very well.
Table 1: The particle properties determined by SwisensPoleno based on the holography images. In each case, the region is the largest contiguous area of pixels of the binarized holography image mapping the 2D projection of the particle.
Ellipse*: The ellipse with the same second-moments as the region. (scikit-image, 2022)
| Feature | Description | Particle characteristic |
| area | Number of pixels of the region. | Particle cross-section |
| bbox_area | Number of pixels of the region. | Area of the maximal horizontal and vertical expansion |
| convex_area | Number of pixels of convex hull image, which is the smalles convex polygon that encloses the region. |
Area of the convex particle hull |
| eccentricity | Eccentricity of the ellipse* that has the same second-moments (Flächenträgheitsmoment) as the region. The eccentricity is the ratio of the focal distance over the major axis length. |
Particle eccentricity (Deviation of the ellipse* from a circe) |
| equivalent_diameter | The diameter of a circle with the same area as the region. |
Equivalent particle diameter |
| feret_diameter_max | Maxiumum Feret’s diameter computed as the longest distance between points around a region’s convex hull countour. |
Maximal particle diamter |
| major_axis_length | The length of the major axis of the ellipse*. | Particle length (ellipse) |
| minor_axis_length | The length of the minor axis of the ellipse*. | Particle width (ellipse) |
| max_intensity | Value with the greatest intensity in the region. |
Maximal particle grayscale intensity |
| mean_intensity | Value with the mean intensity in the region |
Mean particle grayscale intensity |
| min_intensity | Value with the least intensity in the region. |
Minimal particle grayscale intensity |
| orientation | Angle between the vertical and the major axis of the ellipse*. |
Particle orientation |
| perimeter | Perimeter of the object which approximates the contour as a line through the centers of border pixels using a 4-connectivity. |
Particle perimeter |
| perimeter_crofton | Perimeter of object approximated by Crofton formula in 4 directions. |
Particle perimeter |
| solidity | Ratio of pixels in the region to pixels of the convex hull image. |
Particle solidity |
Table 1: The particle properties determined by SwisensPoleno based on the holography images. In each case, the region is the largest connected area of pixels of the binarised holography image mapping the 2D projection of the particle. Ellipse*: The ellipse with the same area moment of inertia as the imaged region. (scikit-image, 2022)
Differentiation of particle types
Already with the equivalent diameter and the eccentricity, many particles can be distinguished from each other. Figure 1 shows that these three types of particles are easy to distinguish on the basis of their shape.
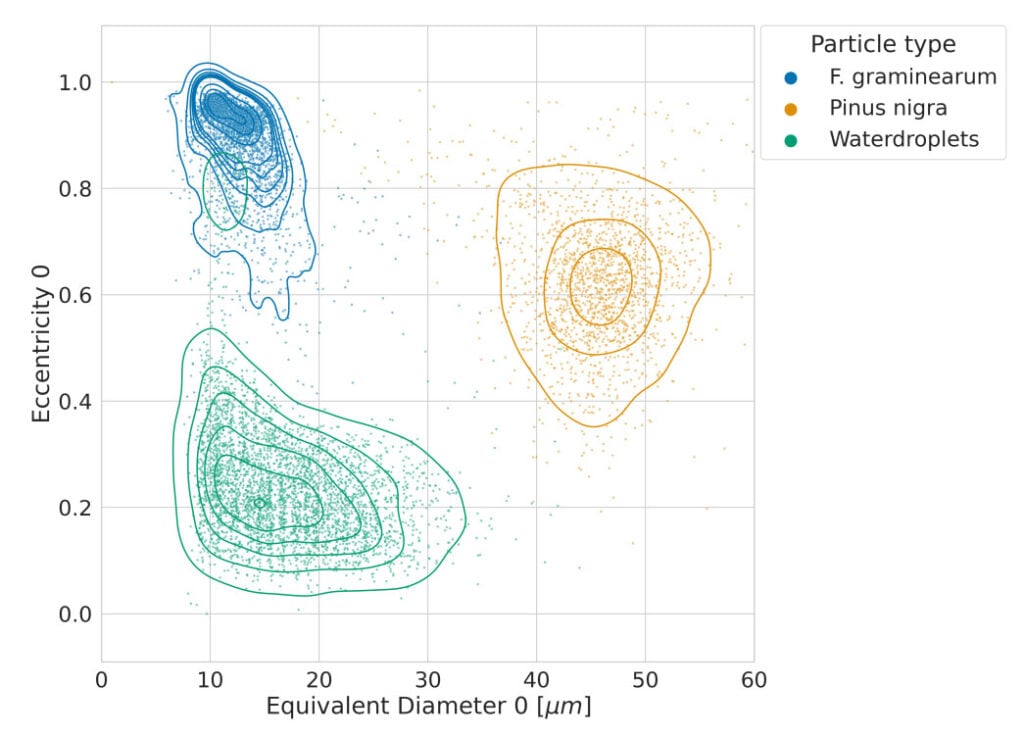
The contour plot in Figure 3 shows the comparison of the equivalent diameter and eccentricity of the three data sets with water droplets, Pinus nigra pollen and F. graminearum ascospores. The contour lines illustrate the shape of the two-dimensional distribution of particle properties. As might be expected, distinct clusters form for the different particle types, with some slight overlap. The elongated F. graminearum spores have similar diameters to the water droplets, but stand out from the round droplets due to their shape. In the case of the Pinus nigra pollen, the size is the decisive distinguishing feature, while the eccentricity overlaps with both other particle types.
Data analyses
With the SwisensDataExplorer we enable comprehensive analyses of measured aerosol particles. The morphological properties of the particles are a pillar of these analyses and allow to distinguish different particle classes, to find contaminants in data sets and to identify particle species. In the following video we show how a comprehensive analysis with SwisensDataExplorer is possible based on the obtained particle characteristics:
Are you interested in a demonstration? We would be happy to give you the opportunity.