- May 17, 2022
- Patrick Minder
How bioaerosol data gets to users
This article describes how we convert individual bioaerosol particles into data available on our screen. In general, we try to answer one main question: How does real-time bioaerosol data get to users? Data transmission in automatic monitoring of aerosol particles (e.g. pollen) in real time is an important issue. The path of the generated data is often unknown and opaque. We would like to change this and show with a simplified best-practice example how the data gets from the particle to the user’s screen. We define users primarily as our customers from the private sector, the scientific community and the public sector.
The starting point
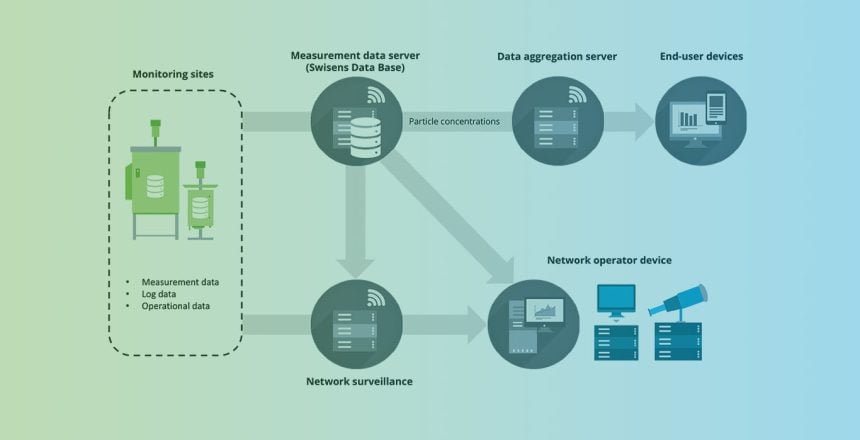
In this best practice example, you can see a setup for a small automated network for pollen monitoring, consisting of a SwisensPoleno Mars, a SwisensPoleno Jupiter, a central database (Swisens Data Base) and the access for the network operator (SwisensDataExplorer). The simplified data path runs from left to right.
How does the data get from the particle to the screen?
Before we look at the data flow, we explain how a bundle of data is generated from individual aerosol particles. To do this, we take a look inside a SwisensPoleno.
From the measurement of the individual particles to the output, the data pass through 3 stations. These are defined by the measurement systems in green, the central database in gray (Swisens Data Base) and the access for the network operators in blue (SwisensDataExplorer). What happens at each of the three individual stations is explained in the following sections.
At the beginning there is the generation of the data. To do this, both SwisensPoleno systems measure the particles contained in the ambient air. They do this by drawing in a volume of air of 40l/min and measuring the particles as they pass through the measurement chamber. One measured particle corresponds to an “event, which stores the following information:
- Measurement data of the particle e.g. particle position and velocity in the measuring channel
- Real-time analysis results i.e. captured particle properties based on holographic images, relative fluorescence intensity & lifetime and polarization.
- Result of the real-time classification i.e. based on the local machine learning identification algorithms.
This event is then stored temporarily on the SwisensPoleno either in the form of a single file (JSON file) or in the database (MySQL) as a table entry. Subsequently, this data is transferred to a central database (also MySQL). The purpose of this temporary storage is to avoid data loss should there be a connection problem (e.g. due to internet failure) with the central database. The local storage of SwisensPoleno can store up to 6 weeks of data on the cache. After that the integrated storage capacity reaches its limit.
Further information on data generation can be found in our white paper.