- May 17, 2022
- Elias Graf
In this blog article you will learn about the relative fluorescence spectrum of SwisensPoleno Jupiter. We will introduce you step by step to the basics of fluorescence and explain the advantages and disadvantages of relative fluorescence in the real-time measurement of bioaerosols.
What is fluorescence?
Before we approach the technical details of fluorescence measurement with SwisensPoleno Jupiter, we must define what fluorescence is in the first place. When molecules are illuminated by a light source, the absorption of a photon can lead to an excited state. In the subsequent transition to a lower energy state, a photon with a higher wavelength can be emitted spontaneously. If this light emission occurs in the nanosecond range after excitation, it is referred to as fluorescence. The emitted spectrum (fluorescence spectrum) and the time between absorption and emission of the photons (fluorescence lifetime) is determined by the excitation wavelength and the composition of the excited material. Thus, the fluorescence spectrum and fluorescence lifetime provide information about the chemical composition of a particle. In many cases, the measurement of these two properties is sufficient to distinguish between different types of particles. In the next section you will learn how we measure both the fluorescence spectrum and the fluorescence lifetime with SwisenPoleno Jupiter.
How do we measure fluorescence with SwisensPoleno Jupiter?
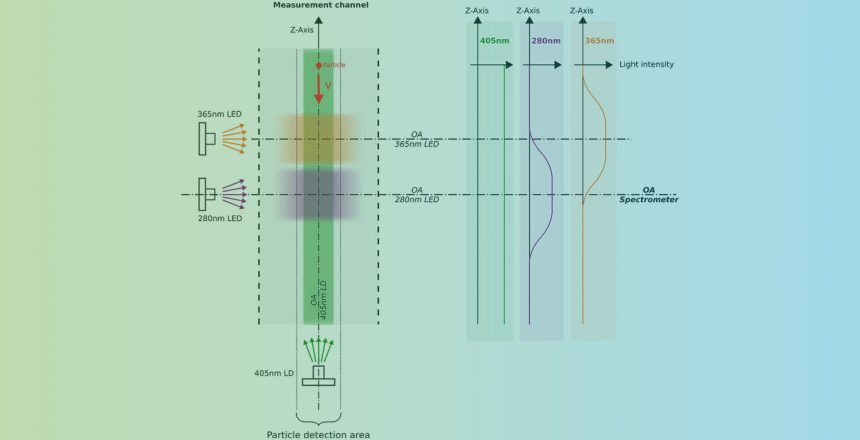
After SwisensPoleno Jupiter has sucked a particle into the measurement channel, it is detected by the trigger lasers. After that, the system first creates holographic images and subsequently measures the fluorescence. In doing so, we obtain information about the spectral fluorescence intensities and the fluorescence lifetime. In this blog, we only address the fluorescence intensities.
The fluorescence measurement in the overview
Each particle is successively illuminated by three light sources with different wavelengths (280nm LED, 365nm LED, 405nm LD), as shown in Figure 1. In response, the excited particle reacts with different fluorescence emissions, which SwisensPoleno Jupiter detects. To do this, it measures the incident light in five different wavelength ranges using SiPM (silicon photomultiplier) sensors. The three excitations and five measurement wavelength ranges thus yield 15 intensity values that characterize the particle.
Ideally, the measured fluorescence intensity values depend only on the composition of the particle, but in reality, this is not the case. The light sources do not have exactly the same intensity everywhere in the measurement channel. This leads to changing fluorescence intensities for a passing particle, since this also depends on the intensity of the excitation (light source). Other unwanted influencing factors are particle size and minimal differences in excitation sources, which in turn lead to changes in fluorescence intensity.
These unwanted dependencies, which are not related to the fluorescence of the particle, make it difficult to directly use the measured absolute fluorescence intensity for particle identification. The effects described are the reason why, instead of absolute, we use relative fluorescence intensity values to distinguish particles with SwisensPoleno Jupiter. The next section will introduce you to this topic step by step.
What is the relative fluorescence spectrum?
To ensure comparability between the SwisensPoleno Jupiter instruments, the relative fluorescence spectrum is used. We calculate the relative spectrum by dividing the measured fluorescence intensity of each detector by the sum of all five detector intensities. This normalization is done separately for each light source, since the unwanted effects are constant per source. The result is 15 relative values without unit with a value range from 0 to 1.
Before the relative spectrum can be calculated, offsets caused by dark pulses of the detectors and by stray light from the sources must be subtracted from the individual measured values.
As mentioned above, thanks to the relative fluorescence spectra, the measurement can be standardized, ensuring comparability between the different SwisensPoleno Jupiter systems. The only disadvantage of the relative spectra is that the information on the absolute fluorescence intensity level is lost, which would be of additional use to distinguish some particles.
To round out the whole topic and make it a bit more tangible, we now look at fluorescence using measured particles with SwisensPoleno Jupiter.
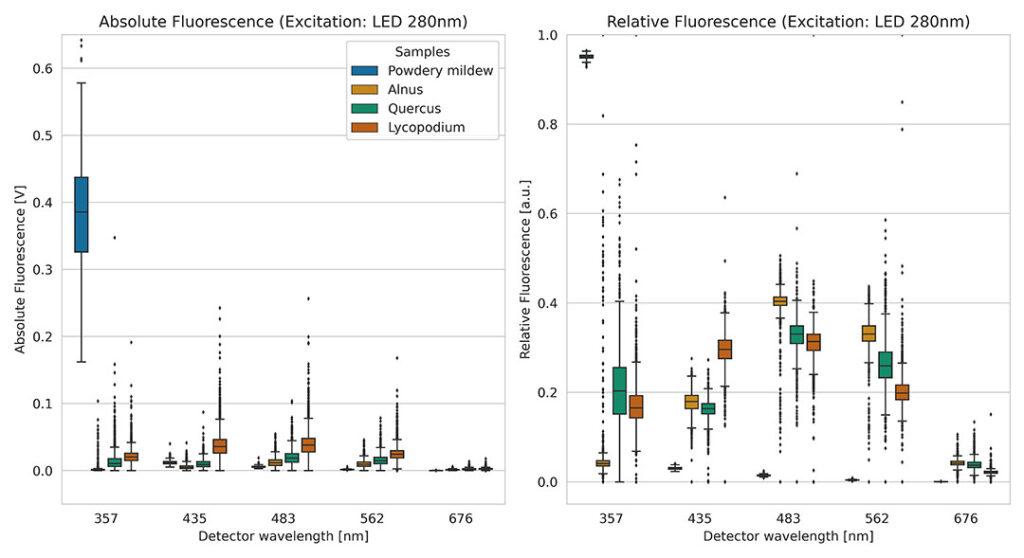
Absolute and relative fluorescence of pollen and spores
In figure 2 four different particle types are compared. The absolute fluorescence spectrum (left) already shows differences. The absolute fluorescence exhibits a broad distribution, which can be caused by size and position differences. The relative spectrum (right) noticeably reduces the scatter, which is particularly evident in powdery mildew. The advantage of narrower distributions is, among other things, better distinguishability.
To better assess the potential for distinguishing different particles with the relative fluorescence spectrum, we need to include all 13 values. For us humans, this is very difficult, as illustrated by the example in Figure 2. To simplify these comparisons, we often resort to dimensionality reduction at Swisens. This allows us to display the relative fluorescence spectra in two dimensions. The comparison of the different particle types is thus very successful. The classification model used by SwisensPoleno Jupiter, based on machine learning, can handle such multidimensional data very well. Thus, the discrimination of aerosol particles in real time with relative fluorescence is very well possible.
Do you still have unanswered questions or would you like to learn more about SwisensPoleno Jupiter fluorescence measurements? We will be happy to provide you with further information.